Documentation for BrandCocoon.com
Industry
In the Industrial section, you will receive a color wheel with the original brand color used. In addition, you choose the appropriate industry, region or country. The matching brand colors of the industry (max. 5000) are entered in the color wheel.
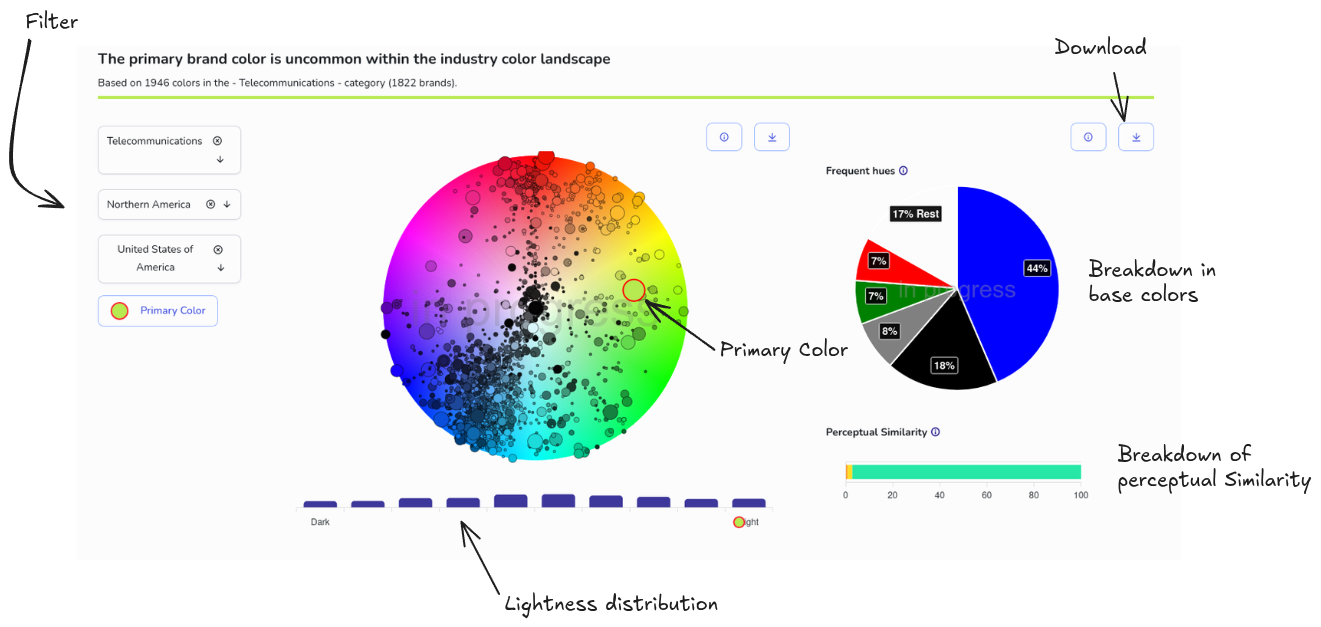
Below the color wheel is the brightness distribution of the colors of the industry.
In addition, you will find a representation of industrial colors according to prevailing basic colors. For this purpose, all industrial brand colors are assigned to 12 basic colors and counted.
The following chart shows the distribution of perceived color distances.
The colors of each industry are measured against the respective primary brand color (color distance in the LCh space) and classified into one of four categories:
0–3: same color
3–10: close competitors
10–20: same neighborhood
20+: distinguishable
The larger the proportion of the 20+ category, the more distinctively the primary brand color occupies its own space in the color space. The percentages refer to the number of industry colors. For example, a value of 90% in the 20+ category means that 90% of all industry colors have a color distance of at least 20 and thus differ from the primary brand color. If, on the other hand, the value is very low (e.g., 5), the brand color blends in with the industry distribution.
You can also tweak the primary brand color in this section. Click on the corresponding button and move the red-bordered dot on the color wheel or use the slider for brightness. When you're done, click "Primary Color" again.
For studies with teams comments are enabled at the bottom.
For approved studies, the selection and editing functions are disabled.