Documentation for BrandCocoon.com
Tools
- Decision Points
- Alternatives Simulator
- Brand Intent vs. Color Checker
- Brand color timeline
- Brand drift analysis
- Stakeholder brand intent
In this area, you will find additional tools for studies. The availability of the tools depends on whether they were created as a “One-Time Color Study” or based on the subscription type.
Decision Points
With a subscription, you can make multiple decisions regarding brand colors over time. For example, if you’re rebranding, you might choose a new color scheme or make minor adjustments to your brand colors.
In this section, you’ll find access to all your saved decisions. This allows you to review the decisions you made at the time.
Alternatives Simulator
The Alternative Simulator is a simple tool that allows you to compare your primary brand color with an alternative color. The assessment is based on the selected competitors (positioning) and the selected filters for industry, region, and country. It highlights the effects on distinctiveness, category similarity, and tone.
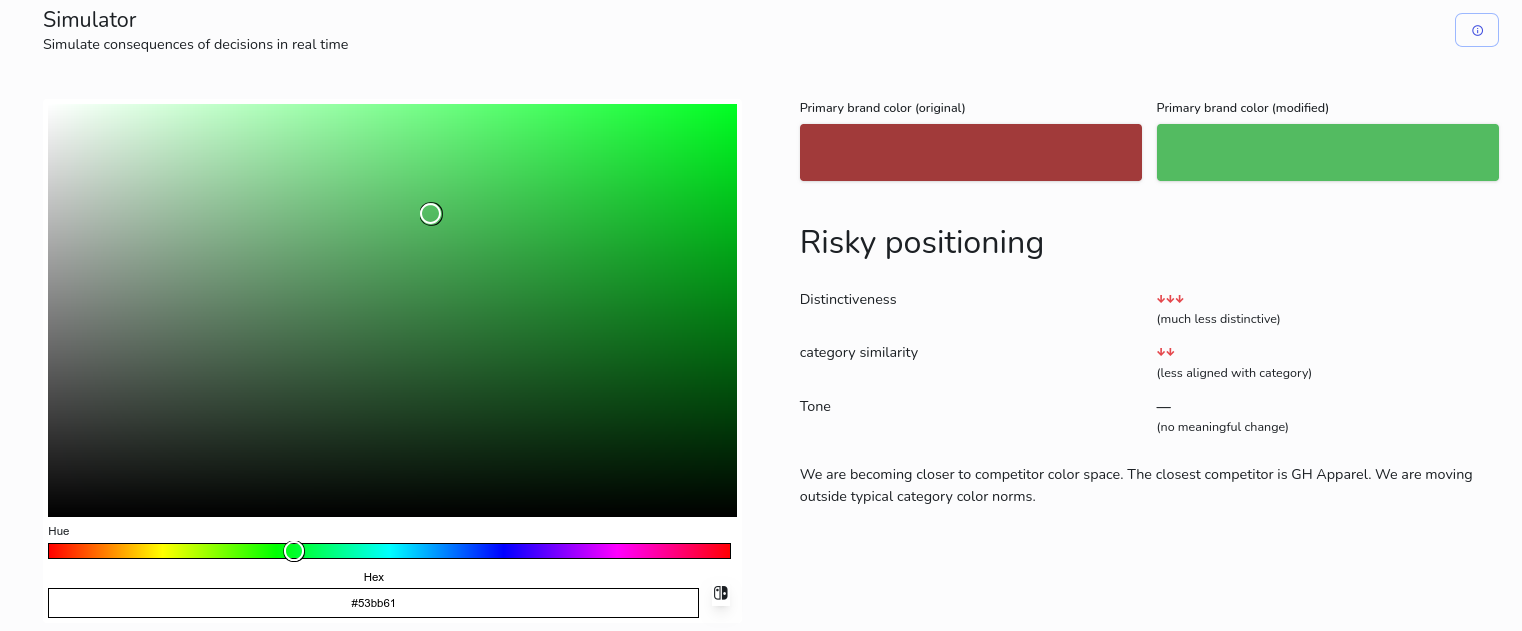
The changes are displayed as arrows and accompanied by a brief verbal assessment. The analysis is based on metrics for competitive positioning and category similarity. The tone is derived from color saturation and brightness.
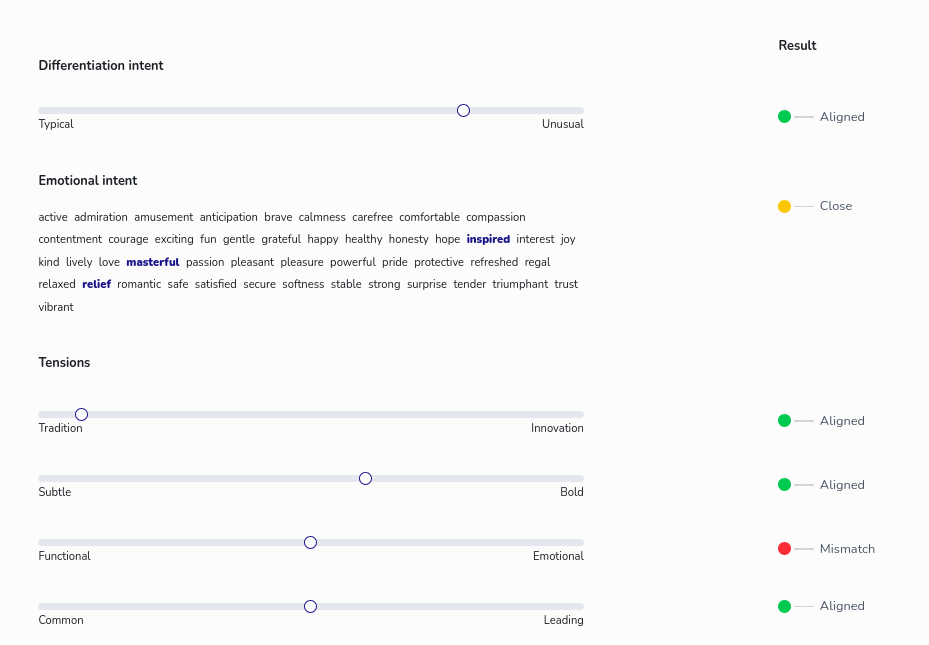
Brand Intent vs. Color Checker
The “Brand Intent vs. Color Choice” Checker is used to compare brand intent with the choice of the primary brand color. It is based on the selected competitors and filters for industry, region, and country. Don't expect scientific accuracy, it is rather an opionated way on aligning intent and color.
The question of differentiation intent is considered in terms of competitive positioning. A high proportion of colors that differ significantly from the primary brand color indicates a high degree of differentiation.
Emotional intent is determined based on the typical emotional associations of the assigned base color.
The value for tradition vs. innovation is determined by the distribution of base colors within the respective industry. The less frequently the base color appears in the distribution, the more this indicates innovation.
The “Tradition vs. Innovation” score is determined by the distribution of primary colors within the respective industry. The less frequently a primary color appears in the distribution, the more this indicates innovation.
The “subtle” vs. “bold” rating is based on 70% saturation and 30% brightness of the primary color.
The classification as functional or emotional is based on emotional strength, saturation, and brightness. The colors black, gray, and white are attributed low emotional strength, while red, yellow, pink, and orange are attributed high emotional strength.
For the “Common vs. Leading” assessment, the frequency of the base color associated with the primary brand color is used in the lower and upper 25% of industry brands sorted by brand awareness: If the base color is more prevalent in the upper 25%, it is considered leading - and vice versa.
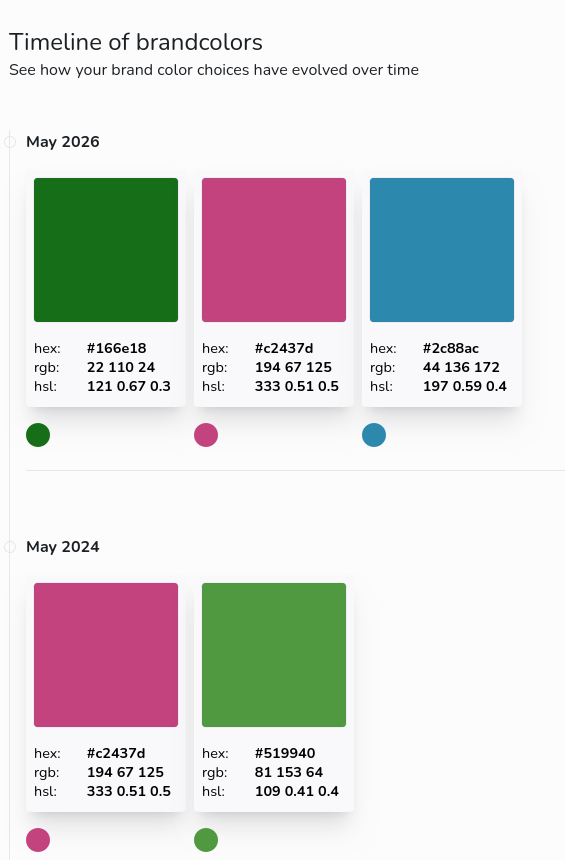
Brand color timeline
The timeline summarizes all color decisions and its rationale in a vertical setting. Good for getting a quick overview how, the colors evolved.
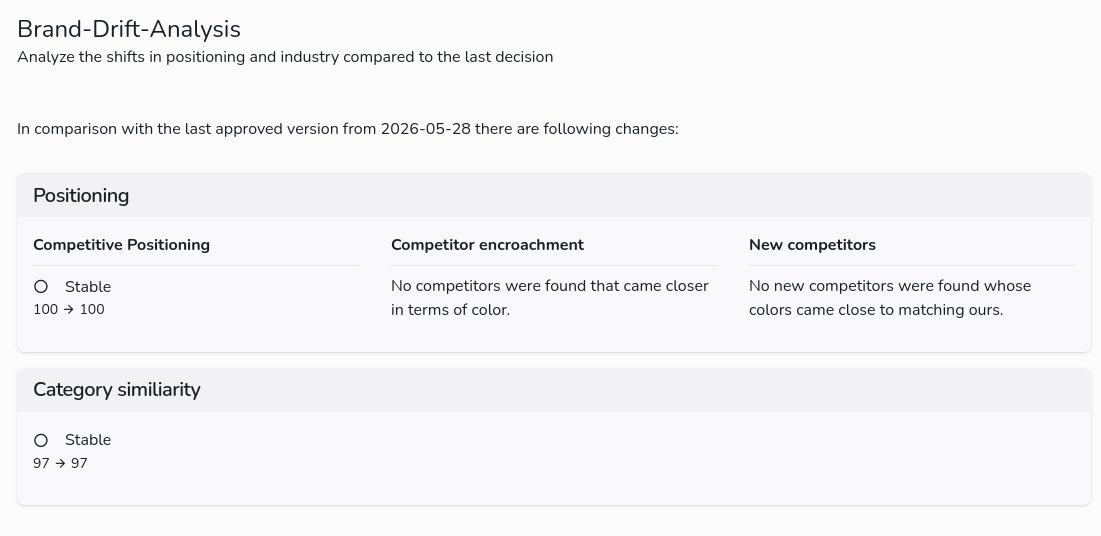
Brand drift analysis
This tool provides an indication of how a brand’s colors compare to those of competitors or industry standards. For subscribers, a monthly comparison with the current reference dataset is performed in the background for approved studies. As the reference dataset is expanded and updated, the data foundation changes. Consequently, the evaluation of the current brand color may also change. The analysis shows the current status and ultimately serves to assess whether it is worth reviewing the decision.
Stakeholder brand intent
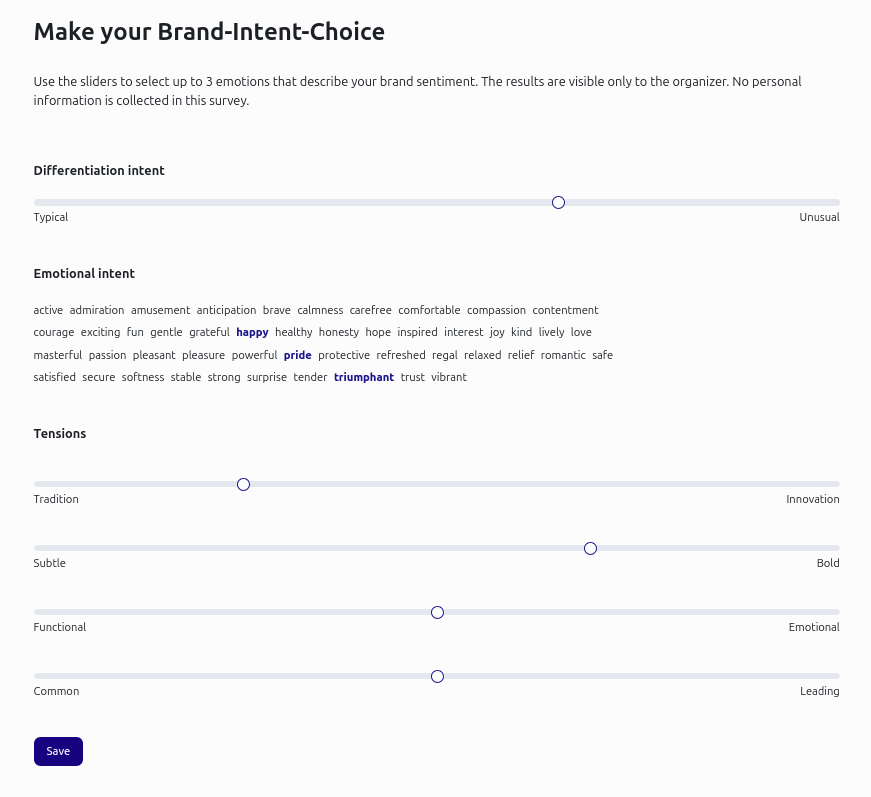
The Stakeholder Brand Intent Tool is a simple way for customer teams to gauge sentiment. It is a type of survey tool with a voting feature.
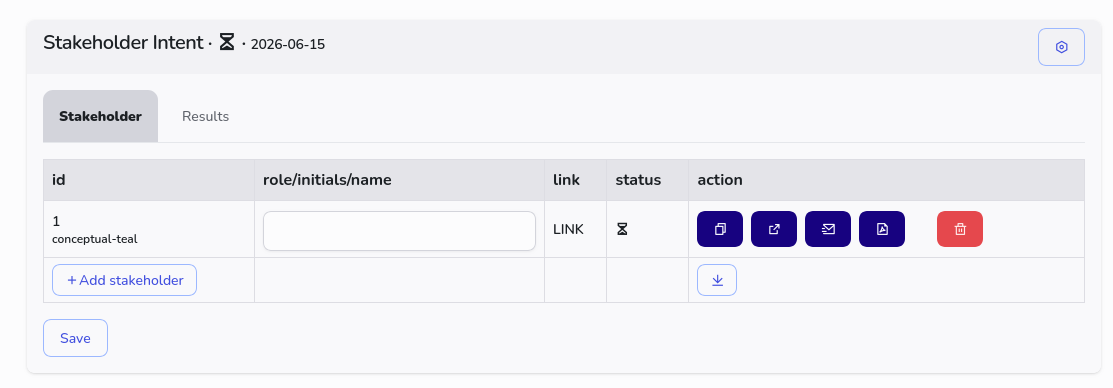
After you’ve created a survey, you can generate a personalized link for each participant. If you’d like, you can enter their role or initials in the text field.
Each participant can use the link to indicate their purchase intent. In your customer account, you can see who has already participated. Under the “Settings” icon, you can rename the survey or close it.
You can view the results in the tab of the same name. From this tab, you can review the distribution and conduct a vote directly via a meeting. Select the final values with a click; they will then be highlighted in green. Once you have selected all categories, you can approve the consensus. An additional tab will appear displaying the decision.
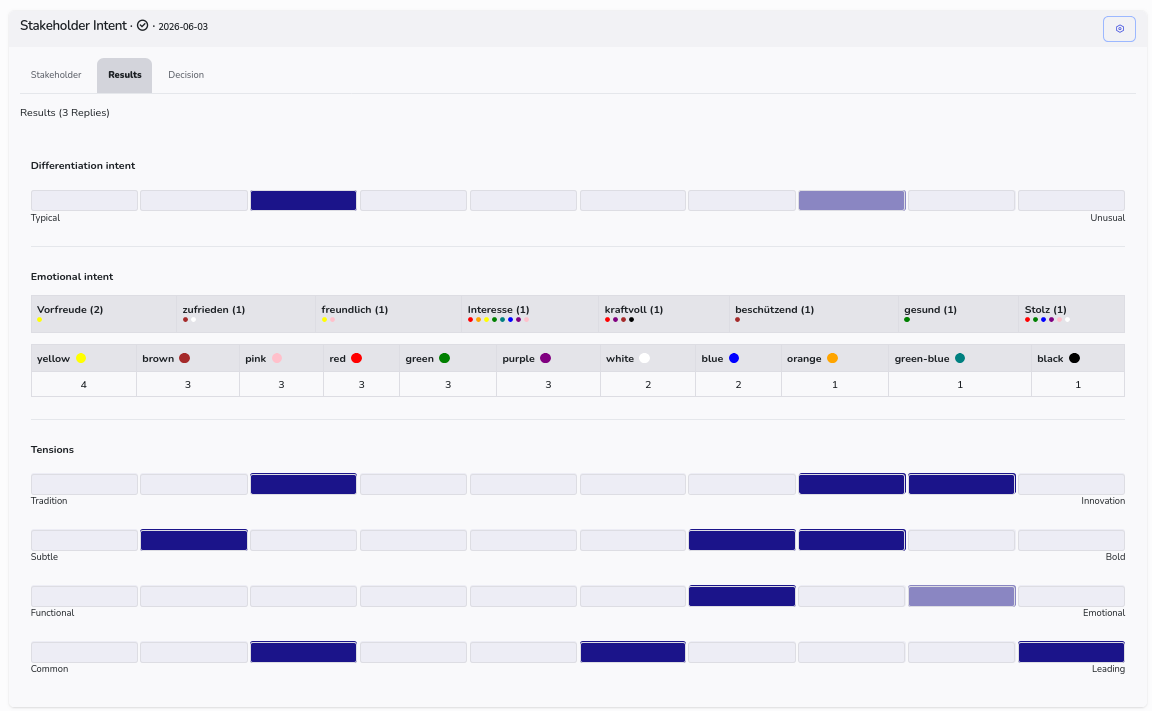
After you approve the stakeholder brand intent results, they are marked as approved and you can use them. If you need to make another adjustment, just add another survey.